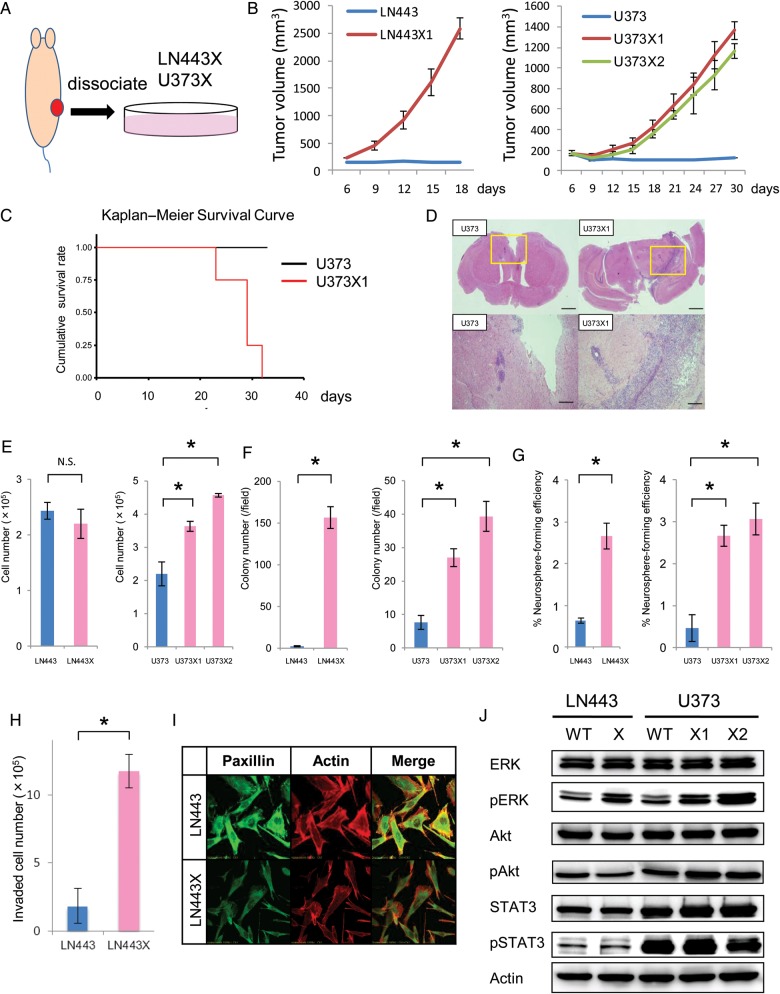
Fig. 1.
Establishment of highly malignant glioma by (A) the scheme of a single subcutaneous passage in mice. In the tissue of mice were s.c. injected 5 × 10⁶ cells of LN443 and U373. The xenografts at 3 months were removed, dissociated, and cultured in the tissue culture dishes. The established cell line from LN443 was designated LN443X and those from 2 subcutaneous tumors of U373 were designated U373X1 and U373X2. (B) Evaluation of the growth in vivo. In the subcutaneous tissue of mice were injected 5 × 10⁶ cells of LN443, LN443X, U373, U373X1, and U373X2. The tumor volumes were calculated as described in Materials and Methods. (C) Kaplan–Meier curves were constructed for mice i.c. implanted with U373 or U373X1. Analysis was performed in 4 mice from each group. Overall survival of mice implanted with U373X1 is significantly worse (P = .012). (D) Representative photographs of intracranial tumors with hematoxylin and eosin staining, consisting of U373 or U373X1. The upper and lower panels show the whole brain sections and magnifications of the insets in the upper panels, respectively. Scale bar, 1 mm (upper panels) and 200 μm (lower panels). (E) Evaluation of the growth in vitro. Cultured in DMEM were 5 × 10⁴ cells of LN443, LN443X, U373, U373X1, and U373X2. The cell numbers of each group were counted at day 5. *P < .01. N.S., not significant. (F) Soft-agar colony formation assay. The number of colonies was counted at day 21 in each group. Error bars represent SD of 3 independent experiments. *P < .01. (G) Neurosphere formation assay. GBM cells were plated as single cells in ultralow attachment plates at a low density (2500 cells/mL) and were grown in neurosphere culture medium for 4–7 days. The spheres were counted and the percentage of nuerosphere-forming cells was determined in each group. Error bars represent SD of 3 independent experiments. *P < .01. (H) Matrigel invasion assay. The invasive cells of LN443 and LN443X on the lower surface of the membrane were counted microscopically. Error bars represent SD of 3 independent experiments. *P < .01. (I) Immunocytofluorescence. LN443 and LN443X were fixed, permeabilized, stained with rhodamine-phalloidin to visualize filamentous actin (red) and with anti-paxillin antibodies to visualize focal adhesions (green), and examined by confocal microscopy. Magnification is ×600. (J) Immunoblot analysis of ERK/MAPK, Akt/PI3K, and Janus kinase/STAT pathways. The levels of ERK, pERK, Akt, pAkt, STAT3, and pSTAT3 were evaluated (top panel to the 6th panel from the top). Actin is shown as a loading control (bottom panel). WT, wild type.

