Fig. 3.
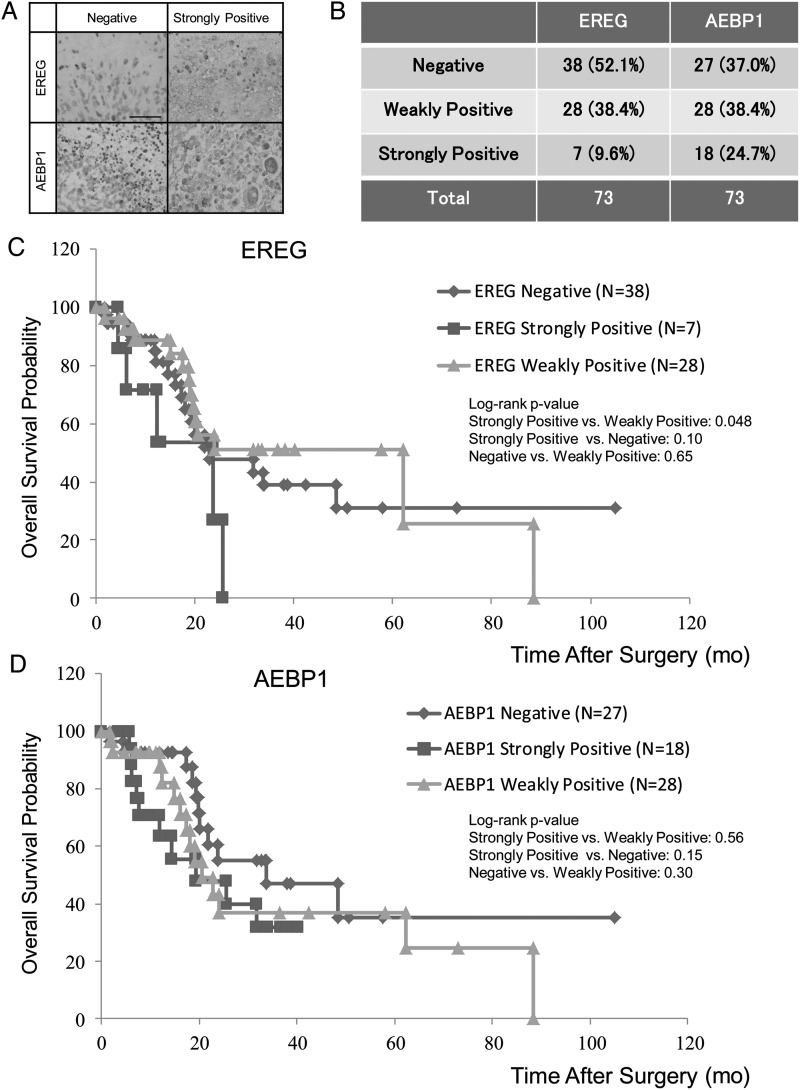
Immunohistochemical analysis of EREG and AEBP1 in GBM. (A) Representative photographs of IHC analysis for EREG and AEBP1 in surgical specimens of malignant glioma whose IHC expression was classified as negative, weakly positive, or strongly positive, as determined by a combination of both intensity score and proportion score described in Materials and Methods. Magnification is ×400. Scale bar, 100 μm. (B) The proportion of IHC positivity for EREG and AEBP1 are indicated. (C and D) Kaplan–Meier survival curves of 73 GBM patients grouped by IHC expression of EREG (C) and AEBP1 (D). Blue line: negative. Red line: strongly positive. Green line: weakly positive. Log-rank P values are indicated.

