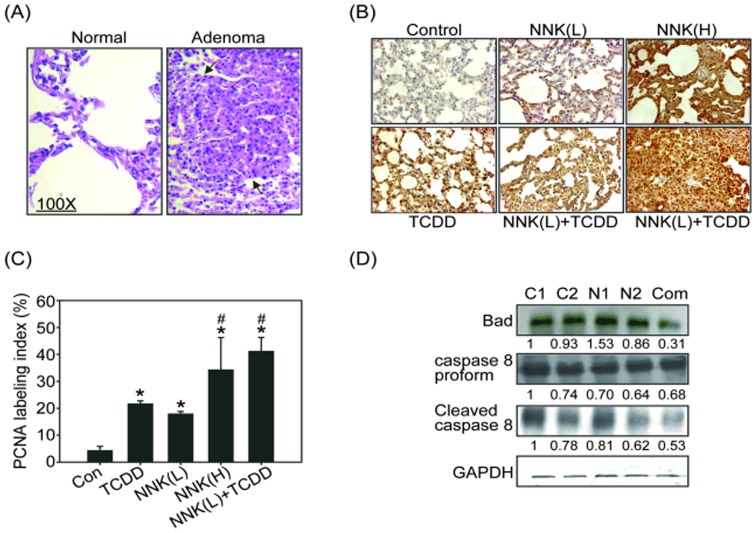
Figure 2. TCDD-induced cell proliferation in NNK pretreated mouse lung tissues.
(A) The histological characteristics of mouse lungs stained with H&E from control and NNK treatment groups. Arrows indicate the adenocarcinoma in the lungs (magnification, X100). (B) Immunohistochemistry (IHC) was used to detect the expression of PCNA (cell proliferation marker) in mouse lung tissues. (C) Quantitative PCNA IHC data represent the mean ± SEM of three results in each group. *p<0.05, significantly higher than the control (Con) group; #p<0.05, significantly higher than the NNK(L) treatment group. (D) Analysis of pro-apoptotic proteins Bad and the precursor and cleaved form of caspase-8 in A/J mouse lung lysates treated with control (C1, C2), low-dose NNK (N1, N2), or NNK(L) combined with TCDD (Com). The results of three independent experiments using three individual mouse lungs were averaged. Representative data from one of the three independent experiments are shown. Equal protein loading was determined using a GAPDH antibody. The number below each line indicates the relative intensity of protein expression compared with that of the control group (defined as 1).

