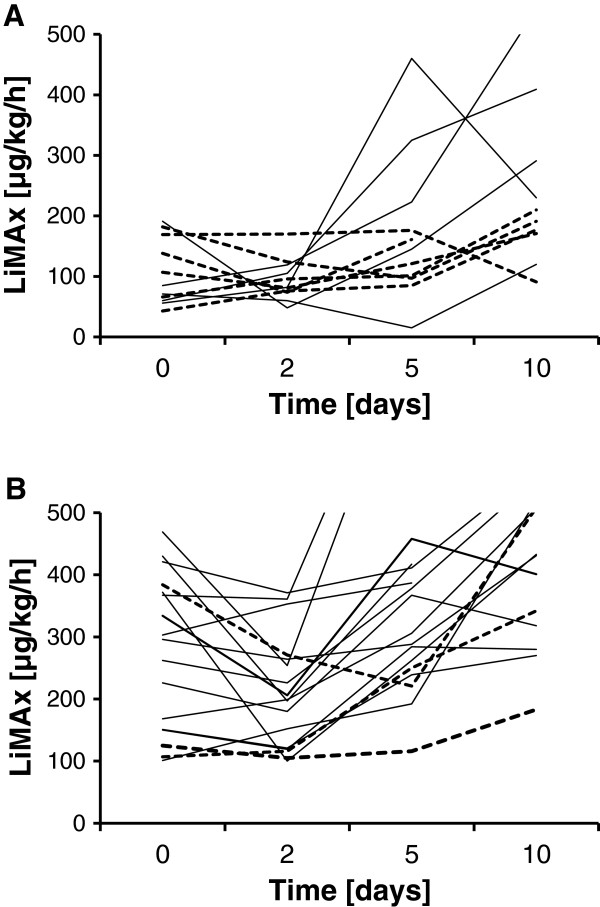
Figure 5.

Maximal liver function capacity progression of individual patients. (A) Patients with minimum maximal liver function capacity (LiMAx) < 100 μg/kg/hour. Bold lines, patients who survived; interrupted lines, patients who died from sepsis. (B) Patients with minimum LiMAx ≥100 μg/kg/hour. Bold lines, patients of group B (survived and ICU length of stay (LOS) <30 days); interrupted lines, patients of group A (deceased or ICU LOS ≥30 days).
