
Figure 2.
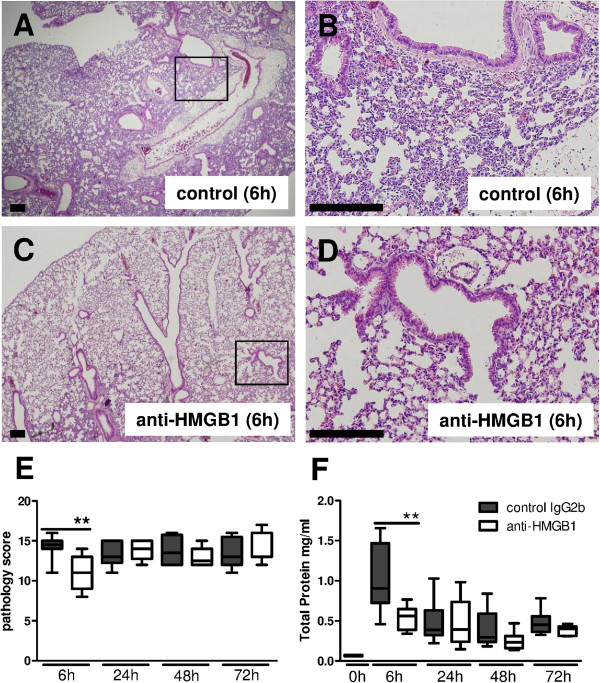
Anti-high mobility group box 1 (HMGB1)-treated mice show reduced lung pathology early after induction of S. aureus pneumonia. Representative slides of lung H&E staining of control treated (A) and anti-HMGB1 treated mice (C), original magnification × 2. The boxed areas are also shown at a higher magnification for controls (B) and anti-HMGB1-treated mice (D), original magnification × 10. Scale bars indicate 200 μm. Total pathology scores were determined at the indicated time points post infection in control treated (gray) and anti-HMGB1 treated mice (white) according to the scoring system described in the Methods section (E). Total protein was measured in BAL fluid from control (grey) and anti-HMGB1 treated (white) mice (F). Data are expressed as box-and-whisker diagrams depicting the smallest observation, lower quartile, median, upper quartile and largest observation (7 to 8 mice per group at each time point). **P <0.01 versus control treated mice at the same time point.