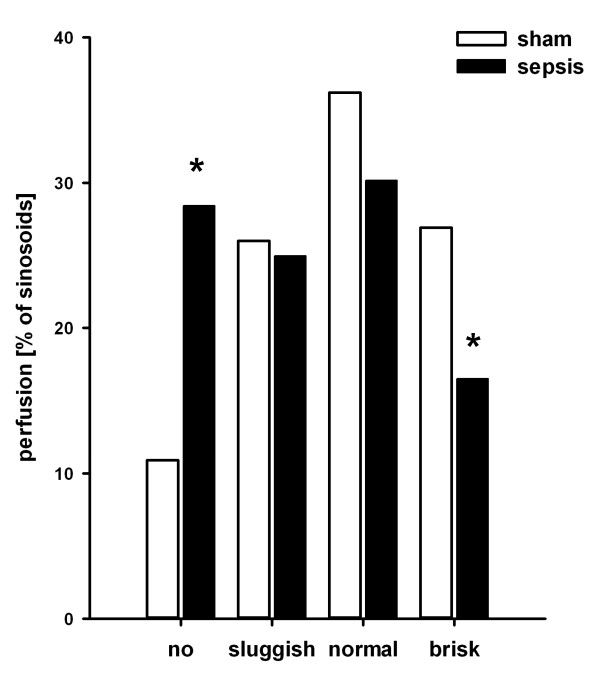
Figure 2.

Effects of polymicrobial sepsis on sinusoidal microcirculation. Sinusoidal microcirculation (n = 4 animals/group, 5 regions of interest/rat) was assessed by intravital microscopy 15 hours after induction of sepsis. Bars represent the proportion of non-perfused sinusoids or velocity of sinusoidal prefusion, respectively. Open bars indicate sham-operated controls; filled bars indicate septic animals. *P < 0.05 for sham versus sepsis ('no': P = 0.009; 'brisk': P = 0.02). Septic animals had an overall shift to reduced sinusoidal perfusion.
