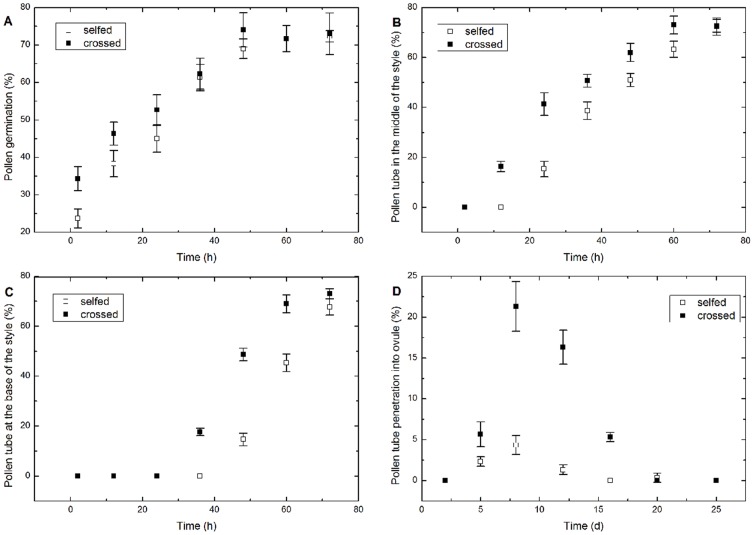
Figure 3. Percentages of pollen and pollen tubes at various stages after SP and CP.
(A). Germinated pollen on the stigma. (B). Pollen tubes in the middle of the style. (C). Pollen tubes at the base of the style. (D). Pollen tubes penetrating into an ovule. Vertical bars represent the standard deviation.

