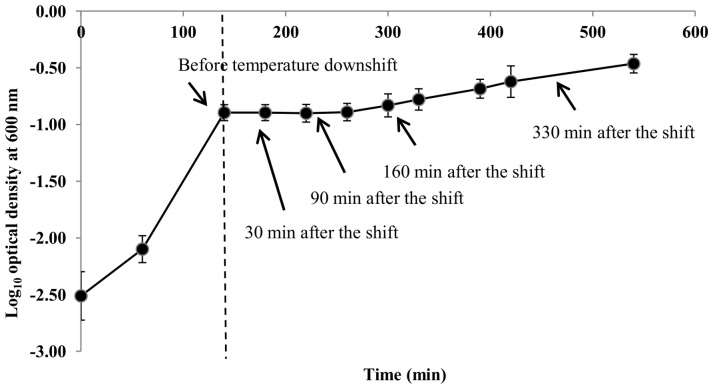
Figure 2. Time series of E. coli O157∶H7 Sakai during a temperature downshift from 35°C to 14°C.
Solid arrows indicate the times at which samples were harvested for cDNA microarray and 2D-LC-MS/MS analyses. The time at which temperature downshift was applied is indicated by a dotted line. Data points represent means ± standard deviations of at least two independent replicates.

