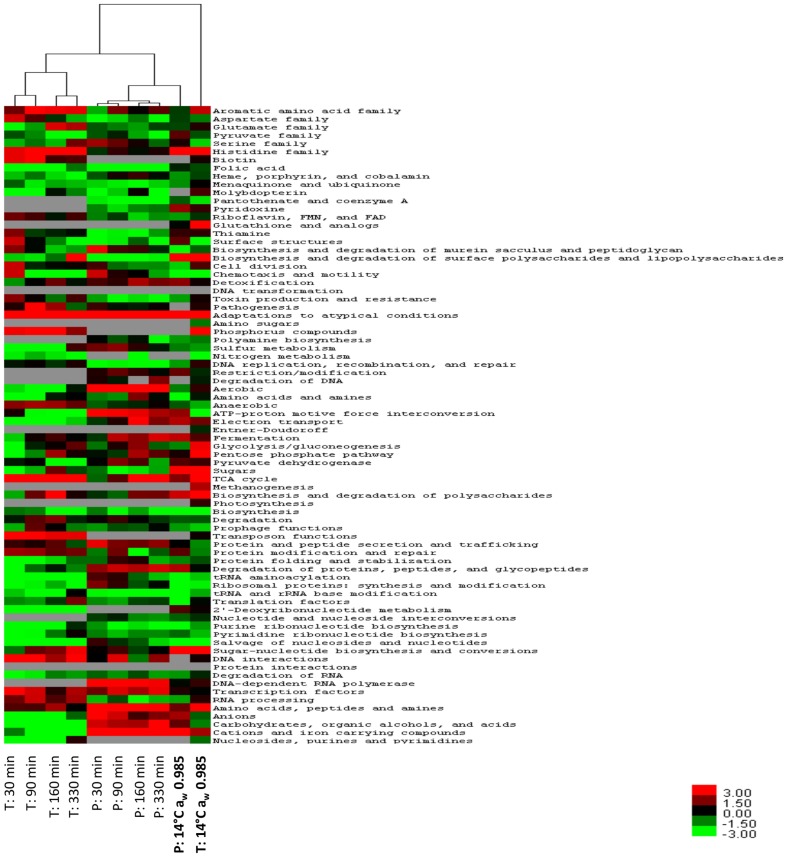
Figure 3. Hierarchical clustering analysis of the transcriptomic and proteomic data.
The heat map represents the T-values calculated for the transcriptomic (T) and proteomic (P) profiles based on JCVI CMR functional categories. Within the dendrogram transcriptomic and proteomic profiles are clustered along with transcriptomic and proteomic profiles of exponentially growing cultures at 14°C aw 0.985 [11]. Positive T-values are represented in red, negative T-values are represented in green and, grey indicates that the T-value has not been determined.

