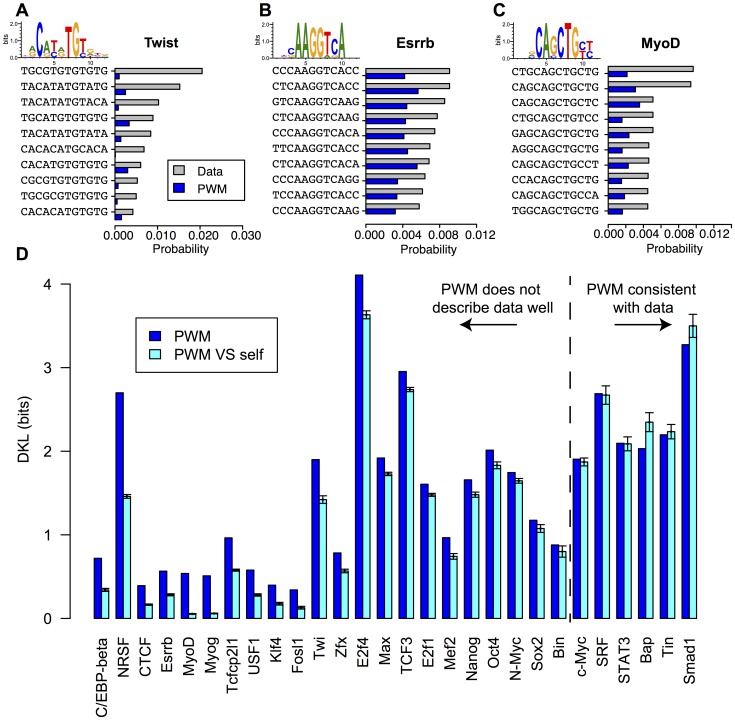
Figure 2. Observed TFBS frequencies are poorly predicted by a PWM model.
Given a set of TFBSs predicted by the PWM model on ChIP fragments, we computed the TFBS frequencies (how many times a given sequence appears in the set, gray bars), and compared them to the PWM predicted frequencies (blue bars) computed using single nucleotide frequencies alone. We show the results for the  most frequent sequences for the TFs Twist (A), Esrrb (B) and MyoD (C). We can see that the use of single nucleotide frequencies alone does not allow one to reproduce the statistics of the most observed binding sites. (D) Kullback-Leibler Divergence (DKL) between the observed probability distribution and the PWM model distribution (blue). As a control we show the mean (cyan bars) along with two standard deviations of the DKL between the PWM model and a finite sample drawn from it (see Methods). A significant discrepancy between the observed and predicted sequence probabilities is reported for 22 out of 28 factors.

