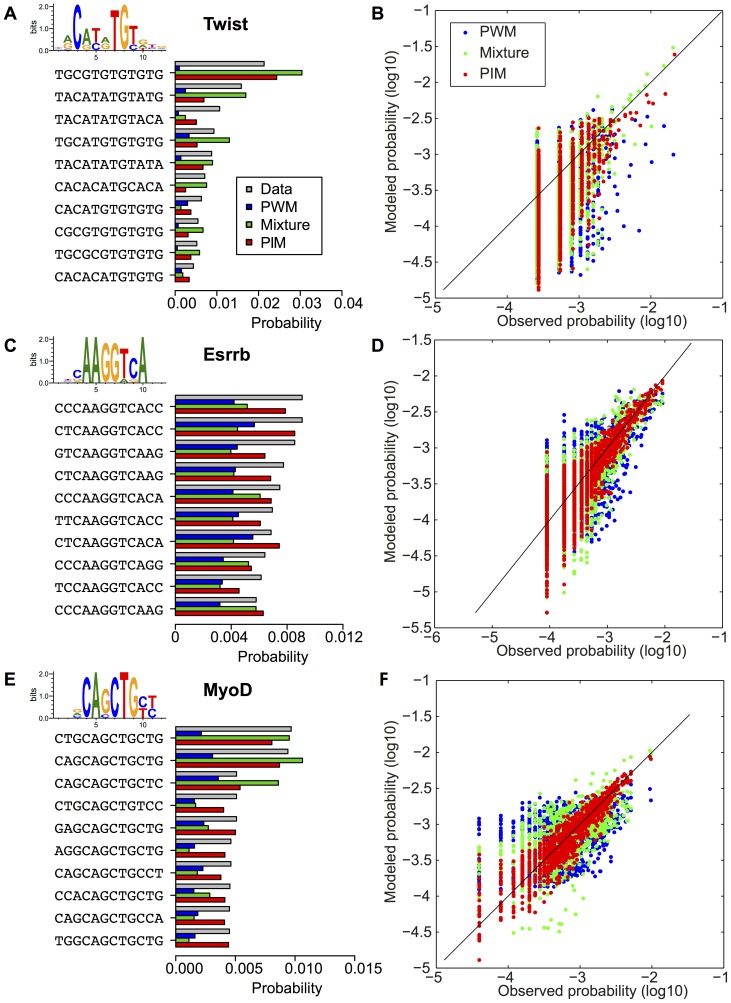
Figure 3. Models with correlations improve TFBS statistics prediction.
Similarly to Figure 2, we show the observed frequencies (gray bars) of the most represented TFBSs for Twist (A), Esrrb (B) and MyoD (C) TFs, together with the probabilities of these sequences predicted by the PWM model (blue bars), the PIM taking into account interactions between nucleotides (red bars), and the PWM-mixture model (green bars). (B,D,F) show the comparison between frequencies for all binding sequences and predicted sequence probabilities for the three models (same color code). The predicted probabilities of the PIM and to a lesser extent of the mixture model are in much better agreement with the observed frequencies than those of the PWM model.

