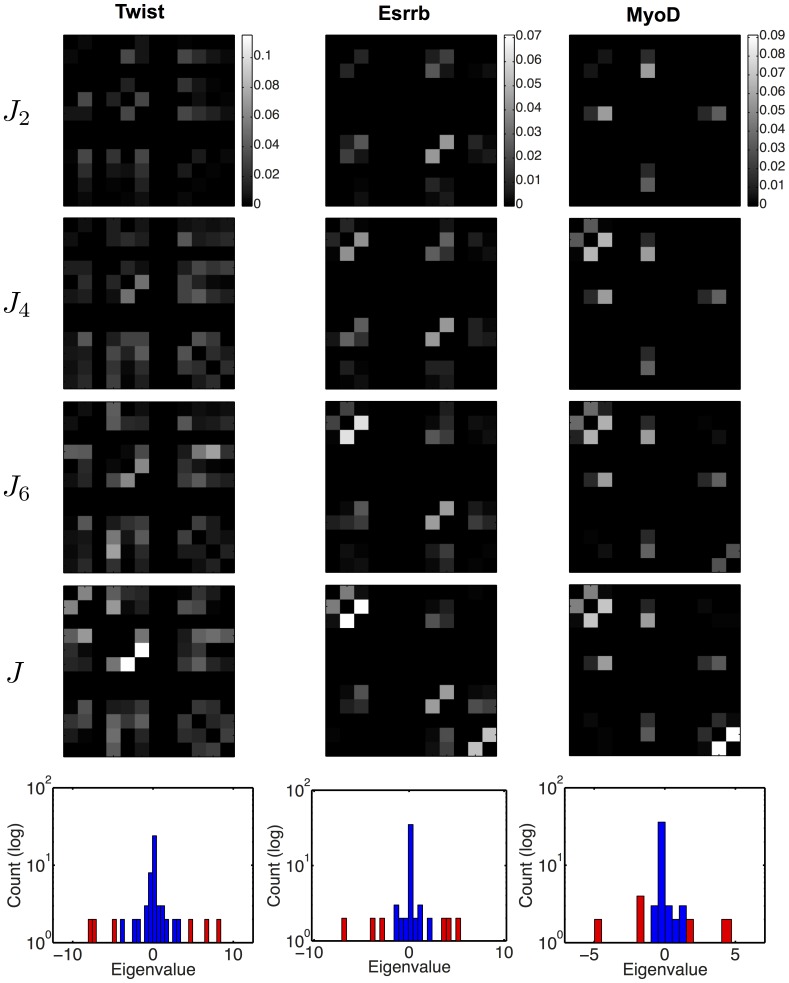
Figure 9. Representation of interactions by Hopfield patterns.
The full interaction matrix  is approximated by a matrix
  built from the
  Hopfield patterns with highest eigenvalue moduli. We show the Normalized Direct Information matrices computed from
  ,
,  ,
,  and the full matrix
  . For MyoD, the correspondence between successive pairs of patterns and distinct interaction domains (middle, upper left and bottom right) is particularly clear. In all cases the full Direct Information matrix is already well approximated by
  . The bottom plots show histograms of the
  eigenvalues of highest moduli (red) and of the other ones (blue). The high eigenvalues lie on both sides of a core of smaller eigenvalues centered around
  .
.

