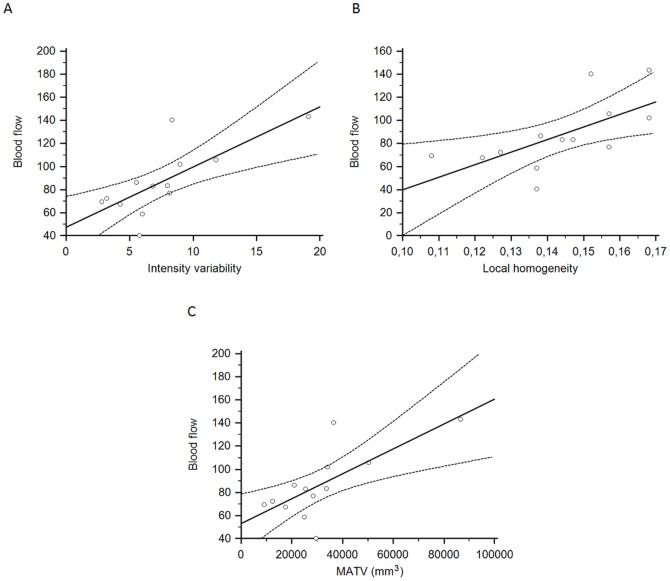
Figure 2. Correlation between PET heterogeneity and BF.
Scatter diagrams with regression line (solid line) and associated 95% CI (curves above and below regression line represented upper and lower bounds of 95% CI) showing the correlation of BF with A) IV (|ρ| = 0.75, 95%CI: 0.35 to 0.92, p = 0.02), B) local homogeneity (|ρ| = 0.78, 95%CI: 0.40 to 0.93, p = 0.01), C) MATV (|ρ| = 0.71, 95%CI: 0.26 to 0.90, p = 0.05) in stage III/IV tumors.

