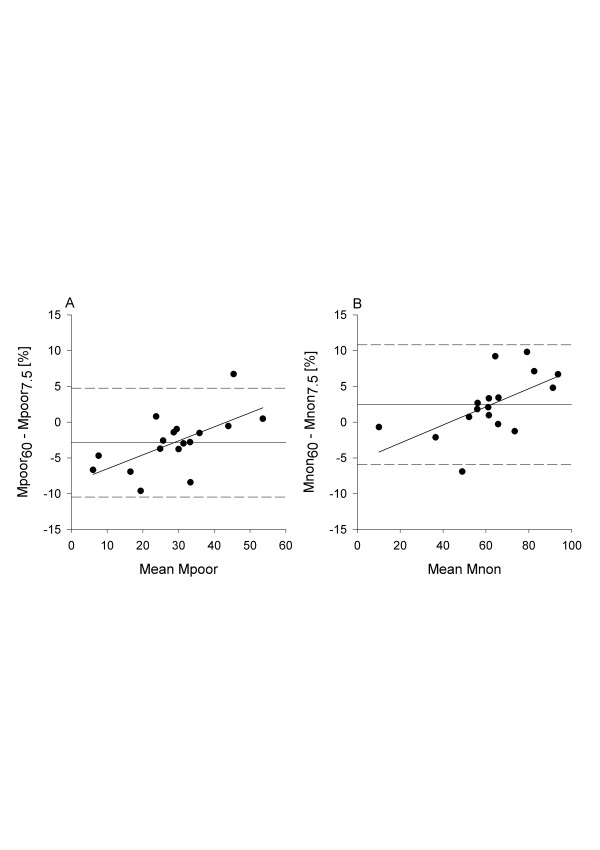
Figure 2.

Bland-Altman analysis of poorly aerated and nonaerated lung tissue for computed tomography scans performed at 60 and 7.5 tube current-exposure time products after the induction of acute respiratory distress syndrome. All masses are expressed as percentages of total lung mass of tissue. Values on the x-axis represent the average of values recorded with two tube current-exposure time products (mAs), for example, mean Mpoor = (Mpoor CT60 + Mpoor CT7.5)/2. (A) Poorly aerated mass: slope = 0.20, r2 = 0.39, P = 0.01. (B) Nonaerated mass: slope = 0.13, r2 = 0.35, P = 0.01. CT = computed tomography; Mpoor = poorly aerated mass; Mnon = nonaerated mass.
