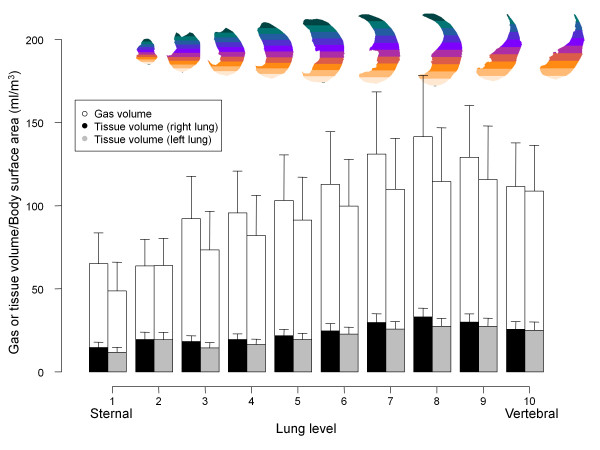
Figure 6.

Gas and tissue volume in 10 sterno-vertebral levels. The sterno-vertebral distribution of gas (white) or tissue (gray for the right lung, black for the left lung) volumes, normalized for the body surface area (BSA). As the image shows, each lung was divided into 10 sterno-vertebral segments of equal height along the apex-base axis, as described by Pelosi and colleagues [6]. Sterno-vertebral levels with the same number were merged (that is, all of the segments level 1 from apex to base, etc.), in order to obtain 10 regions for each lung and then a quantitative analysis was performed.
