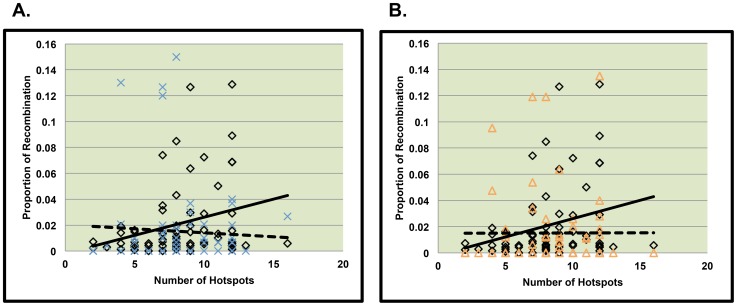
Figure 5. Comparison of slopes between MI or MII errors and controls for the proximal recombinant of double recombinant events.
Figures 5A and 5B represent data from the proximal recombinant event of chromosomes displaying two recombinant events on 21q. The solid line represents the relationship between the number of hotspots per bin and the proportion of recombination per bin along normally segregating chromosomes 21. The dotted line represents the relationship between the number of hotspots per bin and the proportion of recombination per bin along chromosomes 21 from MI errors (figure 5A) and MII errors (figure 5B).

