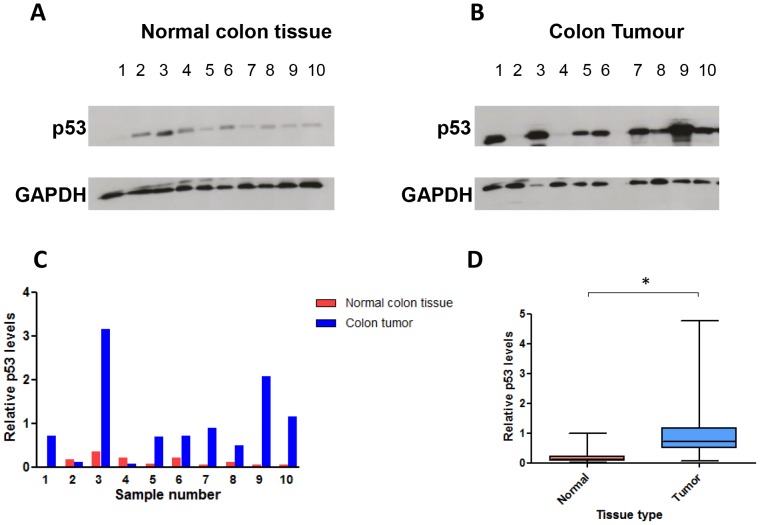
Figure 5. A comparison of p53 expression levels between paired normal colorectal and colorectal tumour tissue samples.
(A & B) Western blot's showing p53 levels in the first 10 normal colorectal (A) and colorectal tumour (B) tissue samples. GAPDH was used as a loading control. (C) Column chart demonstrating the fold changes in p53 expression levels shown in the Western blots (A & B) normalised to GAPDH and calculated using ImageJ software. (D) A box plot comparing the relative expression levels of p53 between all 25 paired colorectal tumour (T) and normal colorectal (N) tissue samples (Student's t test *P<0.01).

