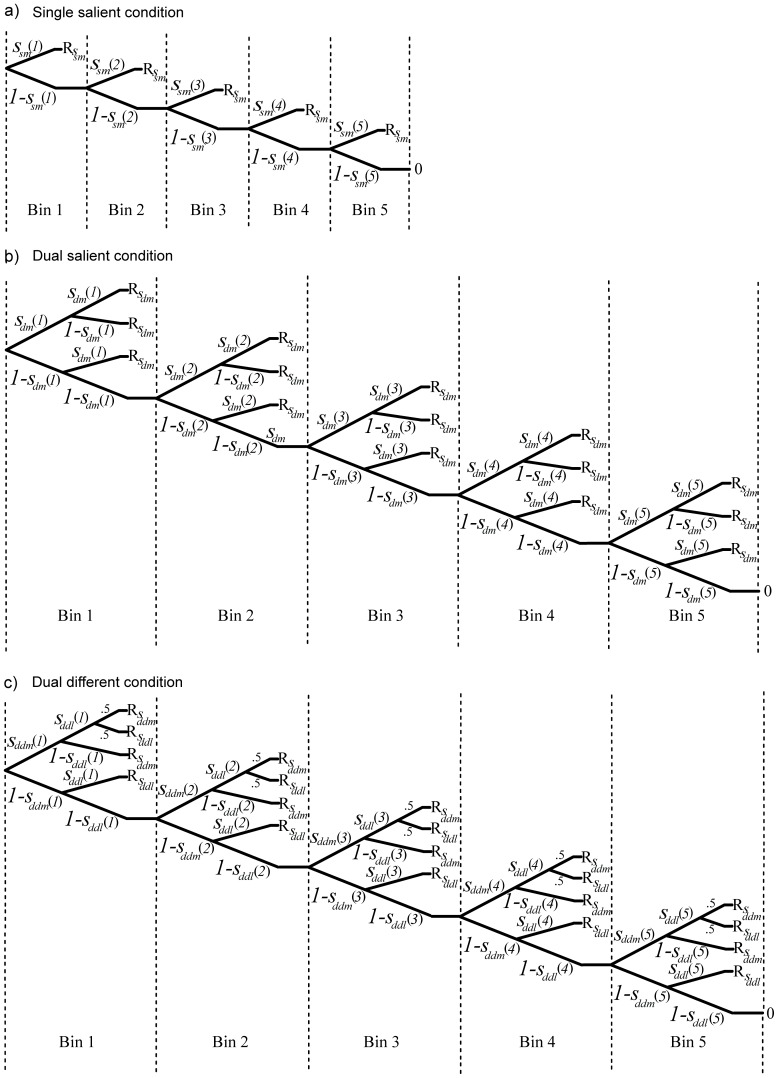
Figure 6. Tree diagrams in Experiment 2.
The tree diagrams correspond to a) the single, b) the dual same, and c) the dual different condition and depict the probabilities that the singleton is available for selection (italics) for each bin (in brackets), leading to a given response outcome (R) for each individual trial. The response outcome is determined through the path leading to it, which equals the product of probabilities on that path. Note that, for reasons of simplicity, the diagrams in a) and b) correspond to the salient singleton only.  denotes the probability that the singleton is available in the single most condition,
  denotes the probability that the singleton is available in the dual most condition, and
  and
and  denote the probability that the singleton is available in the dual different condition, for the more and less salient singleton, respectively.

