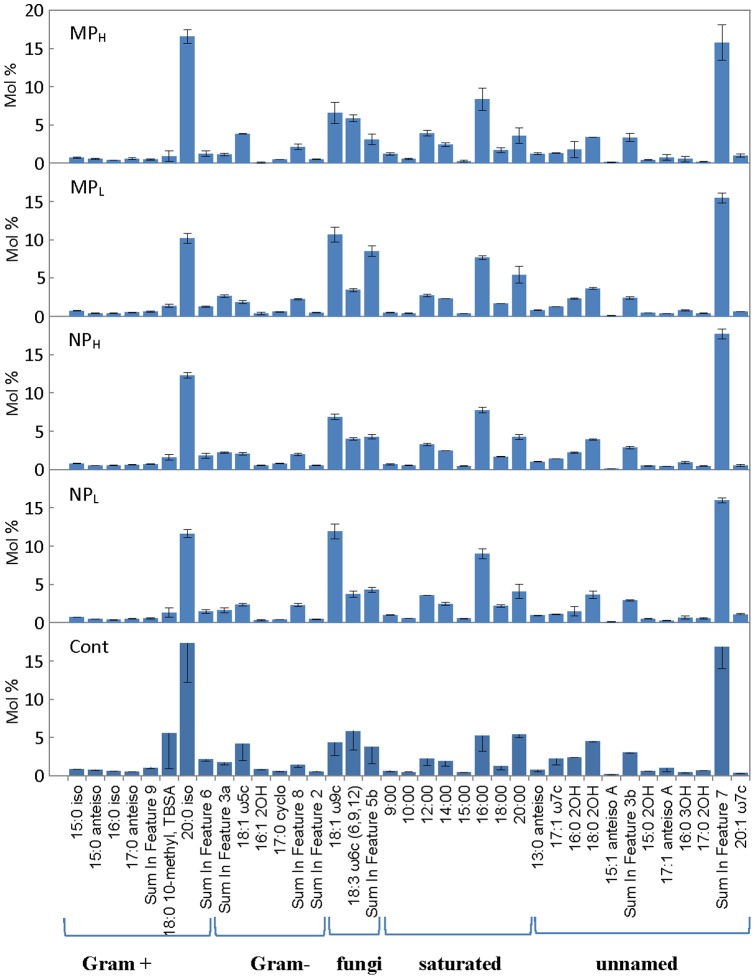
Figure 3. Relative amounts (mol%) of extracted fatty acids (see Methods) in control untreated (Cont) and treated soils: silver nanoparticles at 0.066% (w/v; NPL) and 6.6% (w/v; NPH), and silver microparticles at 0.066% (w/v; MPL) and 6.6% (w/v; MPH) concentrations.
The bars represent the means of three independent fatty acid assessments and the standard errors. The fatty acids are grouped according to their most-frequently associated categories. “Non-signature” fatty acids are indicated as saturated or unnamed.

