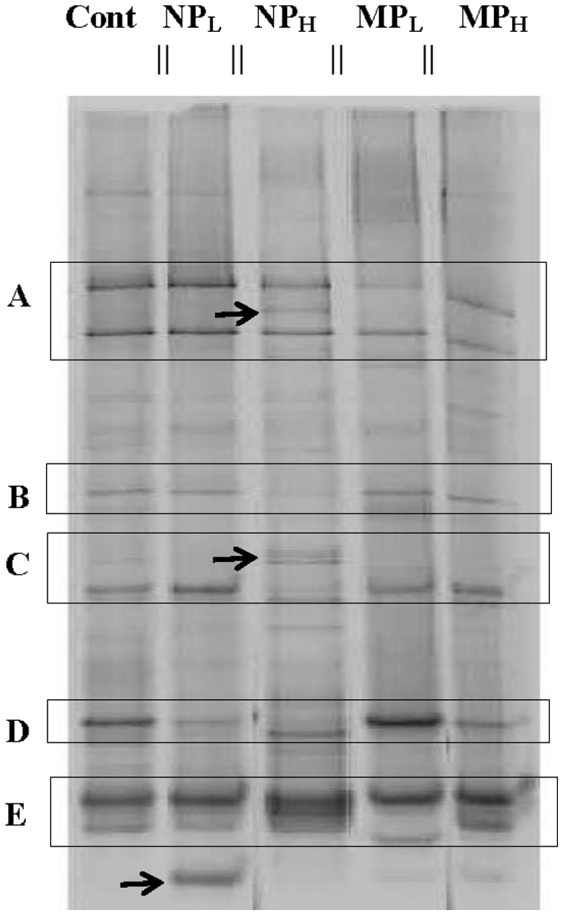
Figure 5. PCR-DGGE profiles of control untreated soil (CS) and treated: silver nanoparticles at 0.066% (w/v; NPL) and 6.6% (w/v; NPH), and silver microparticles at 0.066% (w/v; MPL) and 6.6% (w/v; MPH) concentrations.

Bands represent the migrating positions of the amplified portions of the fungal 18S rRNA gene sequences. Brighter and lighter bands are highlighted by boxes A, B, C and D to facilitate comparisons. New bands, not shared by other treatment groups are indicated by arrows. Gels (3) were electrophoresed with samples obtained from the duplicate treatment samples, but single lanes for each sample are shown in the image in order to facilitate comparisons across treatment groups. Parallel lines on the top of the gel indicate that replicate lanes were trimmed from the representative image.
