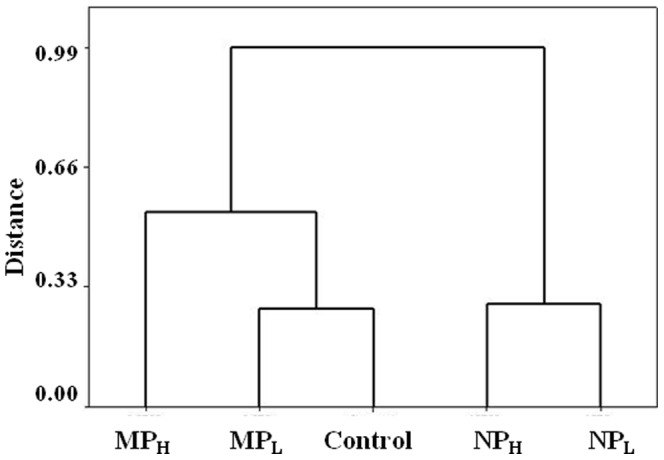
Figure 8. A hierarchical clustering dendogram obtained using Ward's method, an agglomerative clustering algorithm.

Phylogenic composition at the Order level for both bacteria and fungi (present at >0.5% abundance) were subjected to clustering analysis, calculating the total sum of the squared deviations from the mean of the cluster. Clusters collapsed into treatment-groups irrespective of the microbe type. Treatment groups had been incubated for 86 days without NPs or MPs treatment (Control), soil incubated with 0.066% NPs (NPL), soil with 6.6% NPs (NPH), soil with 0.066% MPs (MPL) and soil with 6.6% MPs (MPH).
