Figure 1.
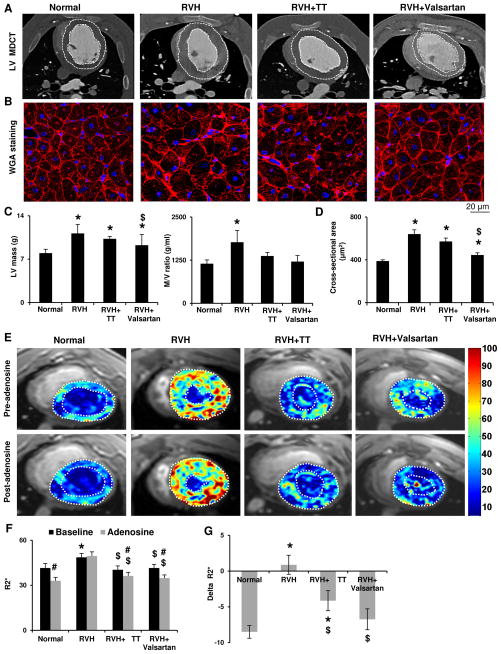
A,C: Representative computed tomography images of left ventricular (LV) structure in Normal, renovascular hypertension (RVH), RVH+triple therapy (TT) and RVH+Valsartan pigs, and quantification of LV mass and its ratio to chamber volume (M/V ratio). White dotted lines outline the inner and outer LV wall boundaries. B and D: Wheat-germ-agglutinin staining and quantification of myocyte cross-sectional area. Valsartan alleviated RVH-induced concentric LV and myocyte hypertrophy. E: Representative blood-oxygen-level-dependent MRI LV images. Hypoxic myocardial regions are indicated as yellow and red colors, in contrast to blue LV chambers filled with oxygenated blood (scale bar). RVH induced myocardial hypoxia, reflected by increased R2* (F), and inhibited its response to adenosine (Delta-R2*, G). Valsartan and TT both improved basal oxygenation, while Valsartan also normalized response to adenosine. *p<0.05 vs. Normal; $p<0.05 vs. RVH; #p<0.05 vs. Baseline.

