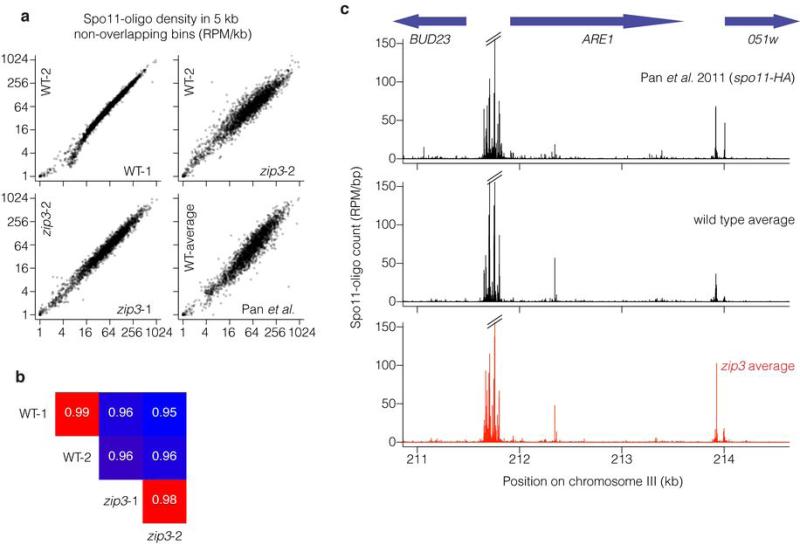
Extended Data Figure 8. Spo11-oligo mapping in wild type and zip3.
a, b, Quantitative reproducibility of Spo11-oligo maps. In a, comparisons are shown for individual wild type (WT) or zip3 datasets from the present study, or the previously published spo11-HA data (from ref 11). Uniquely mapped Spo11 oligos were summed in non-overlapping 5-kb bins and expressed as RPM per kb (plotted on a log scale). In b, pairwise correlation coefficients for the datasets from the current study are shown (Pearson's r; box colors scaled from blue to red proportional to strength of correlation). For the comparison of this study's wild-type average with data from Pan et al., r = 0.949. Note that Pan et al. used a different strain background with different auxotrophies, which may alter DSB distributions61,62, and a hypomorphic spo11 allele (spo11-HA), which may affect DSBs to different extents at different locations56. Note that biological replicates (WT-1 vs. WT-2 or zip3-1 vs. zip3-2) agreed better than comparisons between cultures of different genotype. c, DSBs form at the same hotspots and with similar distribution within and between hotspots in wild type and zip3. Unsmoothed Spo11 oligo maps are shown in the vicinity of the well-characterized ARE1 (YCR048w) hotspot.

