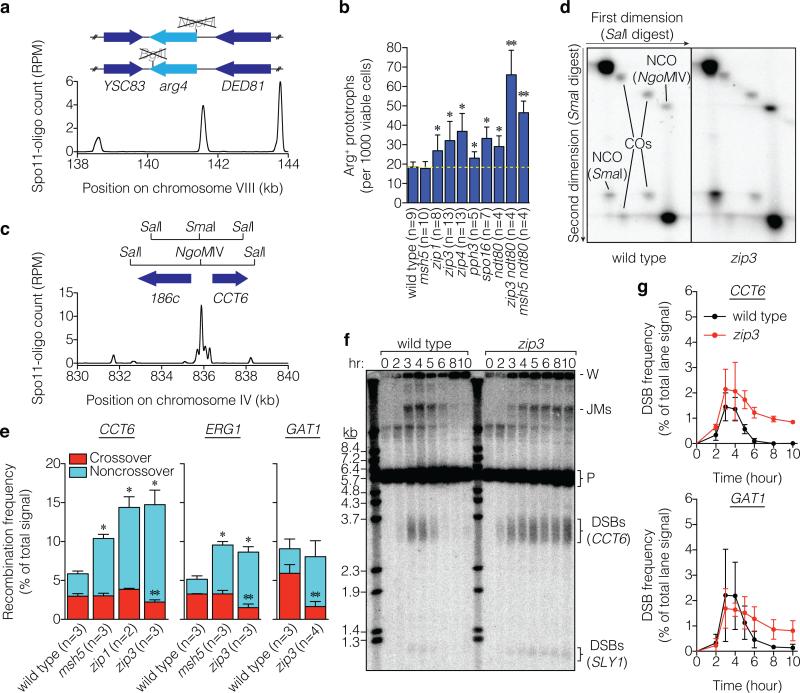
Figure 2. Hyper-rec phenotype of zmm mutants.
a, Schematic of arg4 heteroalleles, showing ORFs and mutated restriction sites. Below, Spo11-oligo profile shows DSB distribution (RPM, reads per million mapped; smoothed with 201-bp Hann window). b, Heteroallele recombination frequencies (mean ± SD). *, significantly different from wild type (p<0.02, t test); **, significantly different from ndt80 (p<0.006). c, Recombination reporter at the CCT6 hotspot. d, Representative Southern blots of parental and recombinant DNA molecules (crossovers (COs) and noncrossover gene conversions (NCOs)) at CCT6 resolved by two-dimensional gel electrophoresis. e, Recombination frequencies (mean ± SD). Crossover frequencies were halved to convert to per-DSB equivalent because each crossover yields two recombinant molecules. *, total recombination significantly different from wild type (p<0.003); **, crossing over significantly different from wild type (p<0.04). f, g, DSBs at CCT6 and GAT1. A representative Southern blot probed for CCT6 is in f and quantifications for CCT6 and GAT1 are in g (mean ± SD for 3 cultures, except 8 hr for zip3 at GAT1, analyzed twice). JMs, joint molecules; P, parental; W, wells.

