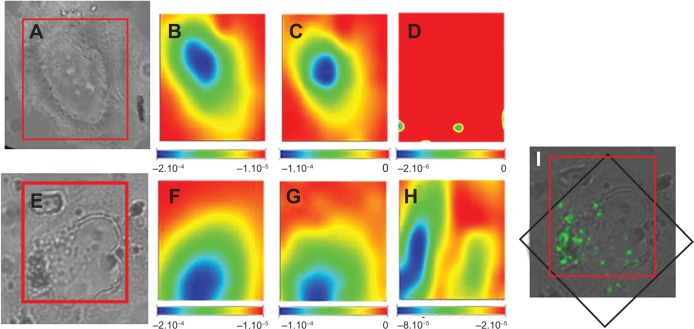
Figure 6.
Chemical imaging using Fourier transform infrared spectroscopy on single cells. (A, E) Light microscope images of a control cell (square dimension, 42×63 μm) and a cell treated with nanoparticles, respectively. (E) Box delineates the area analyzed by Fourier transform infrared spectroscopy (square dimension, 42×63 μm). Chemical imaging for the presence of lipids, proteins (amide I), and poly-lactide-co-glycolide are shown in a control cell (B–D) and in a cell incubated with poly-lactide-co-glycolide iron oxides nanoparticles (F–H). (I) Merge image of the visible light and Fe map from X-ray fluorescence analyses of the cell (E), revealing the iron oxide presence. The red box indicates the area analyzed by Fourier transform infrared spectroscopy, whereas the black one indicates the X-ray fluorescence area.

