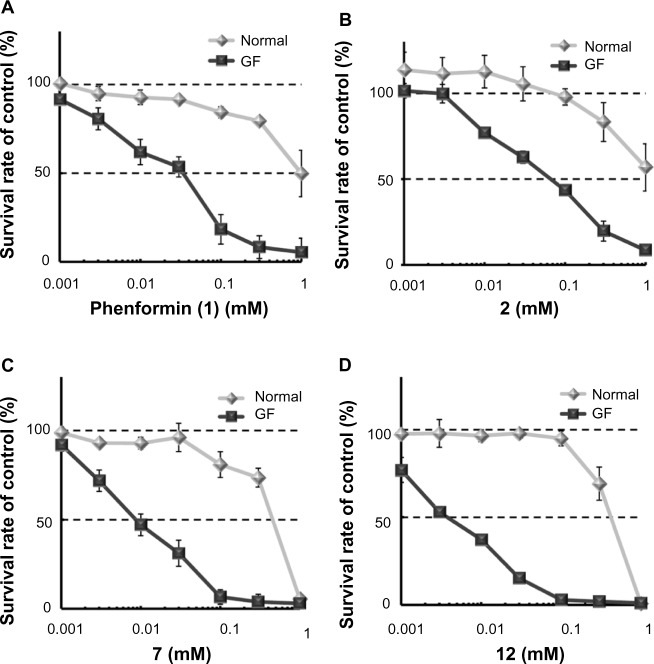
Figure 3.
Selective cytotoxicity of phenformin (1) and compounds 2, 7, and 12 during glucose deprivation.
Notes: Cell viability was determined by MTT assay, using HT29 cells treated with phenformin (1) (A) and compounds 2 (B), 7 (C), and 12 (D), under normal or glucose-deprived condition for 48 hours. Each point represents mean ± SD of triplicate experiments.
Abbreviations: GF, glucose-free; MTT, 3-(4,5-dimethylthiazol-2-yl)-2,5-diphenyltetrazolium bromide; SD, standard deviation.

