
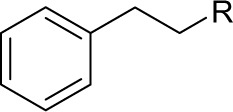
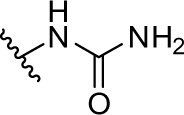
Table 1.
IC50 on HIF-1 and UPR activation and for selective cytotoxicity under glucose deprivation and physical parameters of phenethyl derivatives
| |||||||
|---|---|---|---|---|---|---|---|
| Compound | R | IC50 of transactivation (μM)
|
IC50 of cytotoxicity (μM)c
|
clogD (pH 7.4)e | |||
| HIF-1a | GRP78b | GIc (+) | GIc (−) | ||||
| Phenformin (1) |
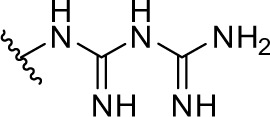
|
27.4±6.1 | 107.8±9.4 | 976.2±95.0 | 46.2±9.2 | 12.2 | −6.64 |
| 2 |
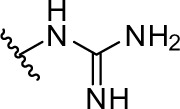
|
23.3±8.0 | 46.1±7.3 | >1,000 | 87.6±4.2 | 13.1 | −2.23 |
| 3 |
|
>100 | >100 | >100 | >100 | −0.2 | 0.81 |
| 4 |
|
>100 | >100 | >100 | >100 | 1.2 | −1.81 |
Notes:
IC50 values for inhibition of HIF-1 activity were obtained using HEK293 p2.1 #3 cells under hypoxia (1% O2) for 24 hours with the test compounds
IC50 values for inhibition of GRP78 promoter activity were obtained using HEK293 GRP78 #85 cells treated with 0.3 mM 2-DG and the test compounds for 24 hours
IC50 values from MTT assay using HT29 cells treated with the test compounds incubated in normal or glucose-free medium for 48 hours. Values are the mean ± SD of triplicate experiments
the pKa values of neutral–monocation equilibria were calculated by ACD/pKa DB Product version 12.5 (Fujitsu Limited, Tokyo, Japan)
the clogD values were calculated by DS Accord for Excel version 7.1.5 (Accelrys Software, Inc., Santa Clara, CA, USA).
Abbreviations: 2-DG, 2-deoxyglucose; GRP, glucose-regulated protein; HEK, human embryo kidney; HIF, hypoxia-inducible factor; IC50, half maximal inhibitory concentration; clogD, calculated distribution coefficient; MTT, 3-(4,5-dimethylthiazol-2-yl)-2,5-diphenyltetrazolium bromide; SD, standard deviation; UPR, unfolded protein response.