
Figure 2.
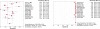
Forest plot for sensitivity, specificity of CXR for the detection of pneumothorax. Inconsistency (I2) describes the percentage heterogeneity across studies that are not due to chance. I2 can be calculated as I2 =100% 3 (Q2df)/Q (see Figure 4 legend for definition of Q). df = degree of freedom = number of studies-1.