
Figure 7.
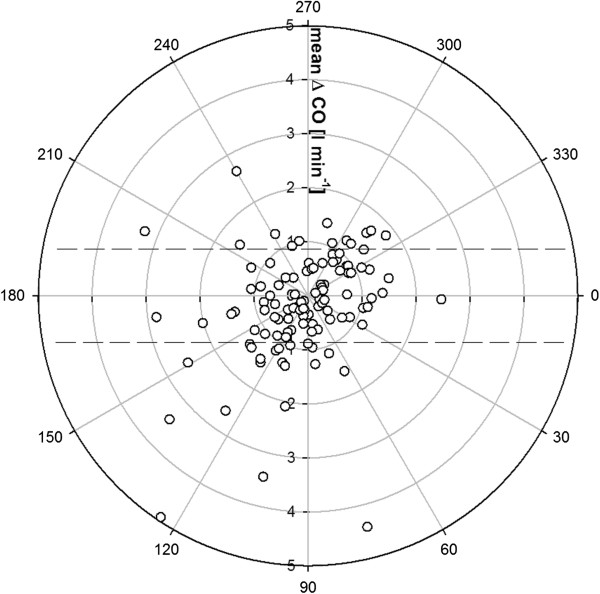
Polar plot with a 10% band as the limit of good agreement. CO, cardiac output.
Official websites use .gov
A
.gov website belongs to an official
government organization in the United States.
Secure .gov websites use HTTPS
A lock (
) or https:// means you've safely
connected to the .gov website. Share sensitive
information only on official, secure websites.
Polar plot with a 10% band as the limit of good agreement. CO, cardiac output.