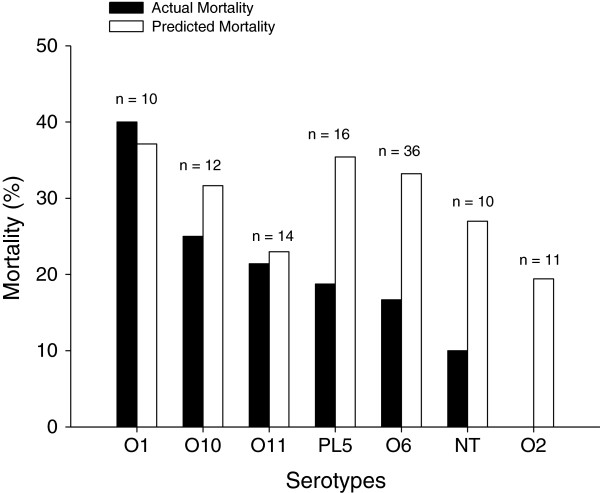
Figure 3.

Percentages of predicted and actual mortality of patients with nosocomial pneumonia caused by different Pseudomonas aeruginosa serotypes. Black bars indicate actual mortality, and white bars indicate predicted mortality estimated according to Acute Physiology and Chronic Health Evaluation II (APACHE II) score. NT, not typeable; PL5, sum of all serotypes with a prevalence of less than 5%.
