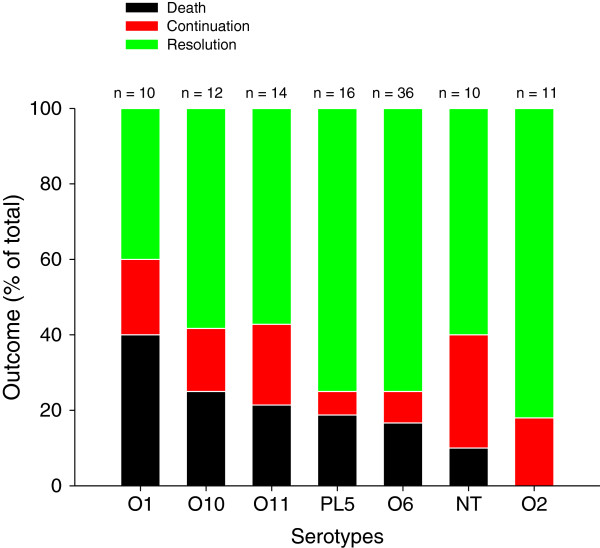
Figure 4.

Proportions of death (black bars), persisting pneumonia (or continuation) (red bars), and clinical resolution (green bars) of patients with nosocomial pneumonia caused by different Pseudomonas aeruginosa serotypes. NT, not typeable; PL5, sum of all serotypes with a prevalence of less than 5%.
