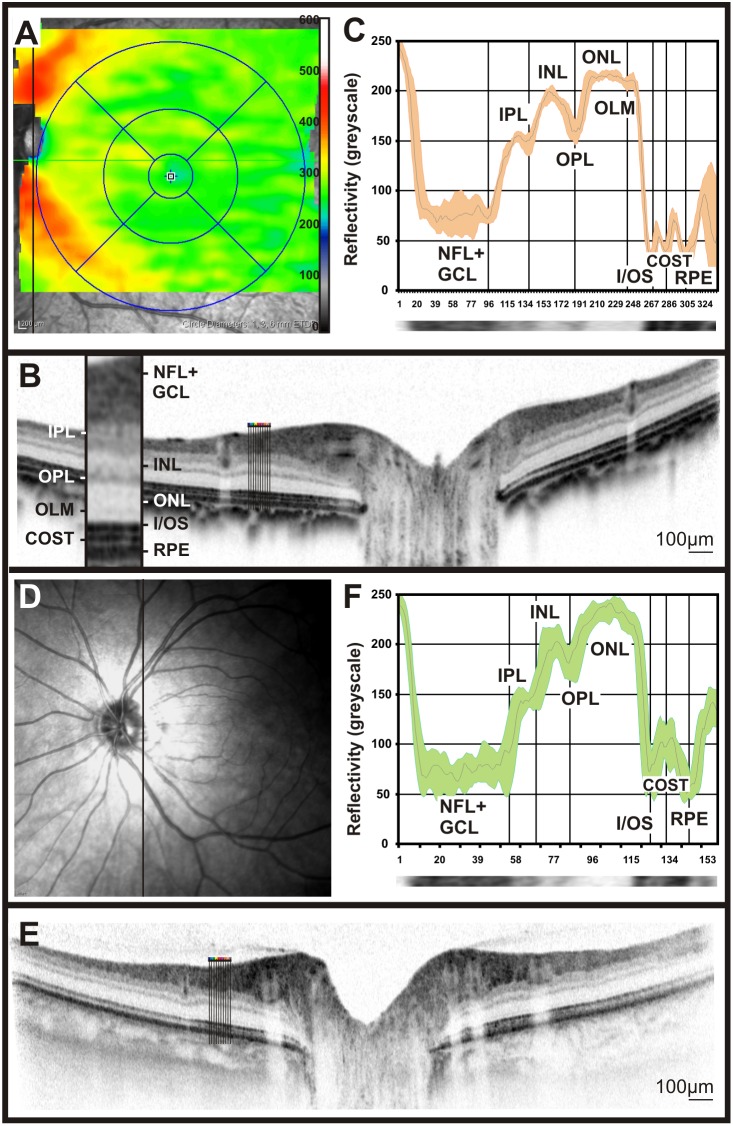
Figure 5. Comparison between the NFL appearance in cynomolgus monkeys and humans by means of OCT reflectivity profiles.
Retinal thickness profile map of a cynomolgus monkey indicates where the thickest areas of the retina are located to, presumably due to the abundance of nerve fibers (A). SLO imaging in one of the researcher’s eye (D). Retinal layering via OCT imaging was performed across the central retina in cynomolgus monkeys (B) and compared to that of humans (E). OCT reflectivity profiles from a region rich in nerve fibers were acquired from cynomolgus monkeys (C) and that of human (F).

