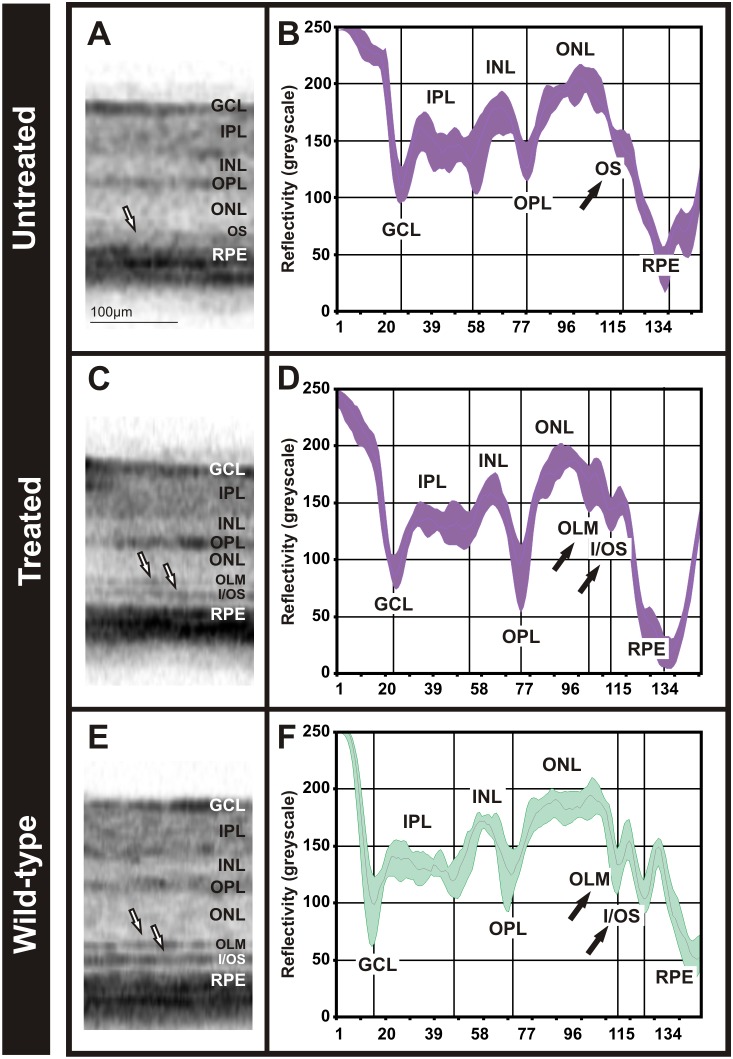
Figure 6. Comparison of retina layer composition and OCT reflectivity profile after a gene therapy approach in the Cngb1 knock-out mouse.
Representative OCT sections of the untreated eye (A), treated (C) in the Cngb1 knock-out mouse and in a C57BL6 control mouse (E). OCT reflectivity profiles from the untreated eye (B), treated (D) and control (F).

