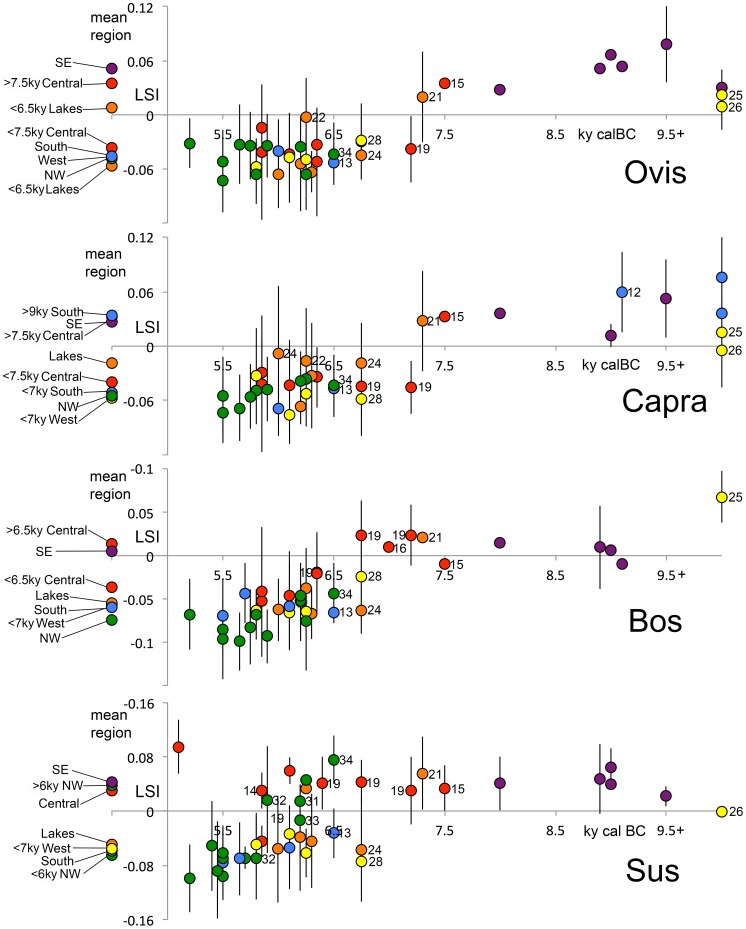
Figure 3. Changes in mean size through time for Ovis, Capra, Bos, and Sus (based on LSI of breadth and depth measurements)(for data see Tables S3–6).
Vertical lines represent standard deviations. Colors reflect geographic location of site (after Fig. 1). Values to the left of the vertical axis represent means for each region. Key sites are labeled (after Fig. 1).

