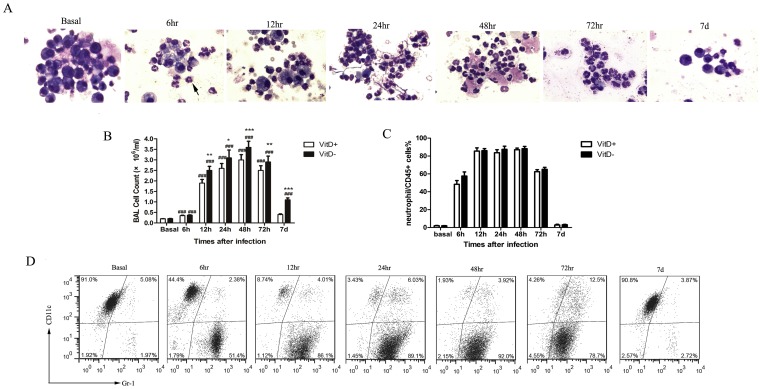
Figure 3. Increased infiltration of inflammatory cells in the lungs of A. fumigatus-challenged VitD- mice.
A. BAL cells were stained with Wright-Giemsa stain and examined under a light microscope after intratracheal challenge with 2×10⁷ A. fumigatus conidia (magnification 400x). B. Total cell counts in BALF were enumerated on a hemacytometer of individual mice after intratracheal challenge with 2×10⁷ conidia. Data are representative of three independent experiments with n = 3 per group (mean±SE) and analyzed by paired Student's t test. p<0.001(###), for comparison of A. fumigatus-challenged VitD+/VitD- mice versus baseline levels; p<0.001(***), p<0.01(**), p<0.05(*), for comparison of VitD+ with VitD- mice. C. BAL cells were analyzed by flow cytometry after intratracheal challenge with 2×10⁷ conidia. Lavage cells were gated by CD45+; the resulting populations were further identified on the basis of CD11c and Gr-1expression and sorted as shown by the density plots. Within the CD45+ population, the major cell types were macrophages (CD11c+Gr-1+/−) at baseline, neutrophils (CD11c−Gr-1+) became the major cell types 6–72 hr post infection. Flow cytometry was performed to quantify the percentage of cell types in CD45+ cells. D. Flow cytometry was performed to quantify the percentage of neutrophils in CD45+ cells in BALF after intratracheal challenge with 2×10⁷ conidia. Neutrophils (CD11c−Gr-1+) were gated from the CD45+ cells based on Gr-1 and CD11c expression profiles. Data are representative of three independent experiments with n = 3 per group (mean±SE), and analyzed by paired Student's t test.

