
Figure 3.
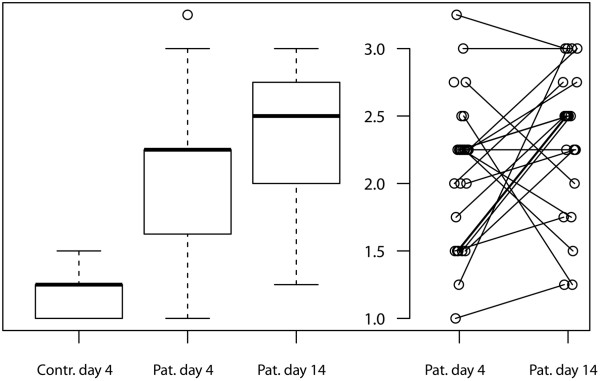
Boxplots of mean echotexture over four anatomical regions. For patients, additional parallel coordinate plots are shown to illustrate differences over time. Each patient is represented by a grey circle. Contr., control; Pat., patient.
Official websites use .gov
A
.gov website belongs to an official
government organization in the United States.
Secure .gov websites use HTTPS
A lock (
) or https:// means you've safely
connected to the .gov website. Share sensitive
information only on official, secure websites.
Boxplots of mean echotexture over four anatomical regions. For patients, additional parallel coordinate plots are shown to illustrate differences over time. Each patient is represented by a grey circle. Contr., control; Pat., patient.