Figure 1.

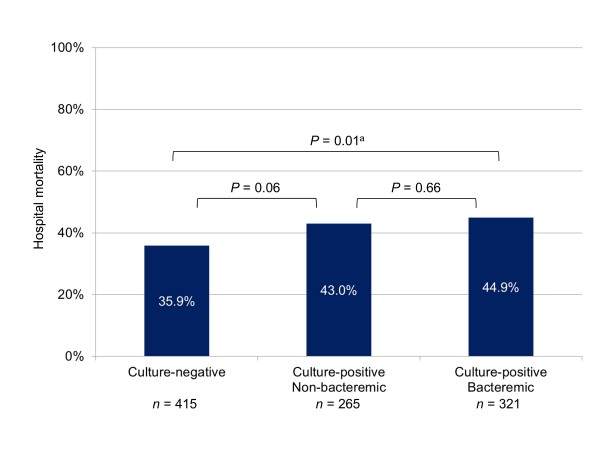
Hospital mortality for subgroups according to cultures and bacteremia. Overall P value for comparison between three subgroups was 0.03. Listed P values refer to comparisons between two subgroups. aSignificant after Bonferroni correction.

Hospital mortality for subgroups according to cultures and bacteremia. Overall P value for comparison between three subgroups was 0.03. Listed P values refer to comparisons between two subgroups. aSignificant after Bonferroni correction.