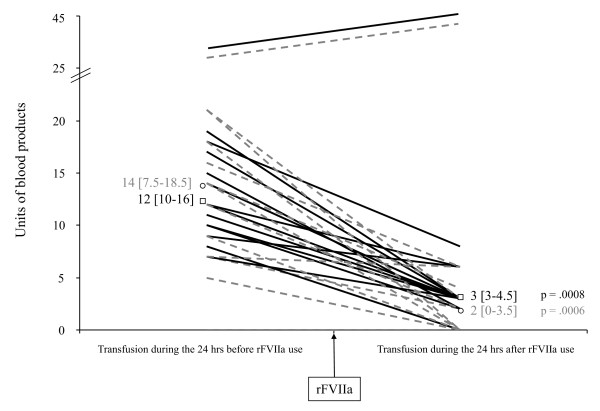
Figure 2.

Blood-product transfusions before and after recombinant activated factor VII (rFVIIa) infusion. Each line represents one patient. Black lines, red blood cells; dashed gray line, fresh-frozen plasma, with respective medians [25th to 75th interquartile range] as □ and ○.
