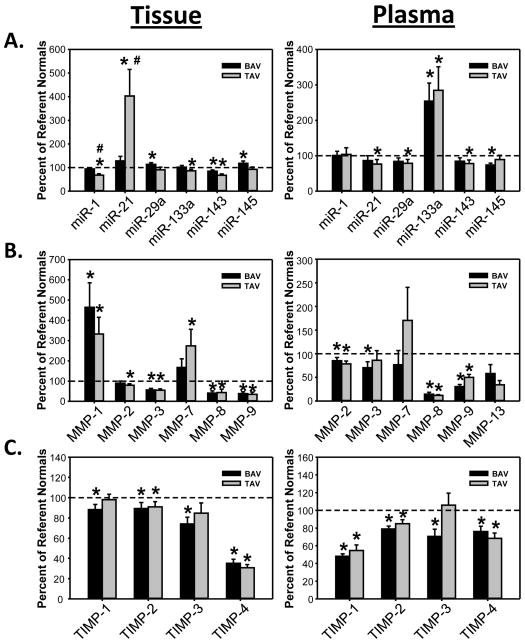
Figure 1.
Aortic tissue and plasma analysis for miRs, MMPs and TIMPs, comparing ascending TAAs associated with BAV or TAV from normal aortic samples (dashed line). Significant differences were observed between the BAV and TAV groups, and between the aneurysm groups and normal aorta.
* p<0.05 from normal aorta, # p<0.05 from BAV

