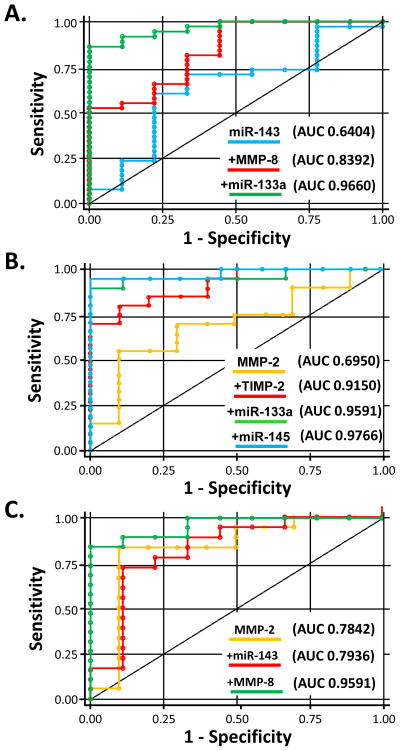
Figure 3.
Receiver operating characteristic curves to assess plasma aneurysm predictability. Inclusion of plasma analytes using forward stepwise variable selection resulted in different combinations for TAA in general (top), BAV-associated TAAs (middle) and TAV-associated TAAs (bottom) providing high area-under-the curve (AUC) values, indicating high sensitivity and specificity.

