
Figure 3.
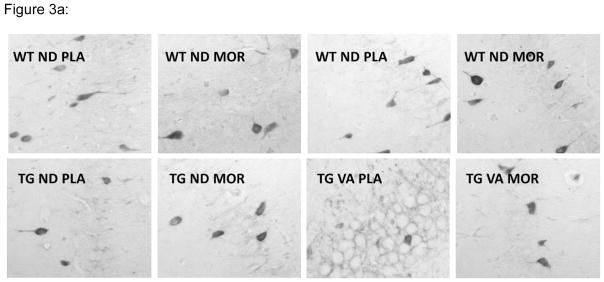
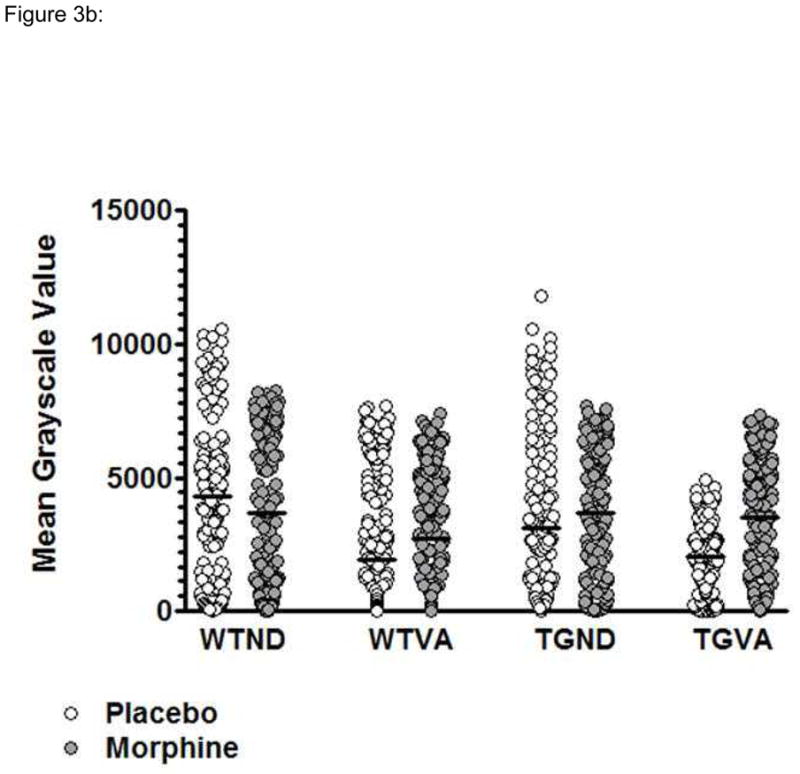
Comparison of mean levels of parvalbumin expression in hippocampus CA1 region neurons for TG and WT rats on a normal or vitamin A deficient diet and treated with either placebo or morphine (WTND = wild type rat, normal diet; WTVA = wild type rat, vitamin A deficient diet; TGND = transgenic rat, normal diet; TGTVA = transgenic, vitamin A deficient diet). (A) Representative 10x fields from Immunoperoxidase stained sections. (B) Plots of the distribution of mean density values for a representative animal from each group.