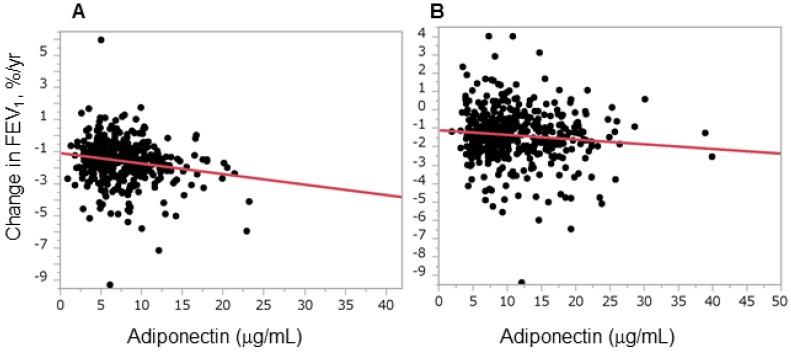
Figure 2.
Plasma adiponectin levels were inversely correlated with annual changes in forced expiratory volume in 1 s. The graphs show the relationships between annual decline in forced expiratory volume in 1 s (FEV1) and plasma adiponectin levels in men (A) and women (B). Correlations were evaluated using Pearson's product moment correlation coefficient. A statistically significant relationship was observed in both men and women (A, r = -0.17, P = 0.001; B, r = -0.10, P = 0.033).

