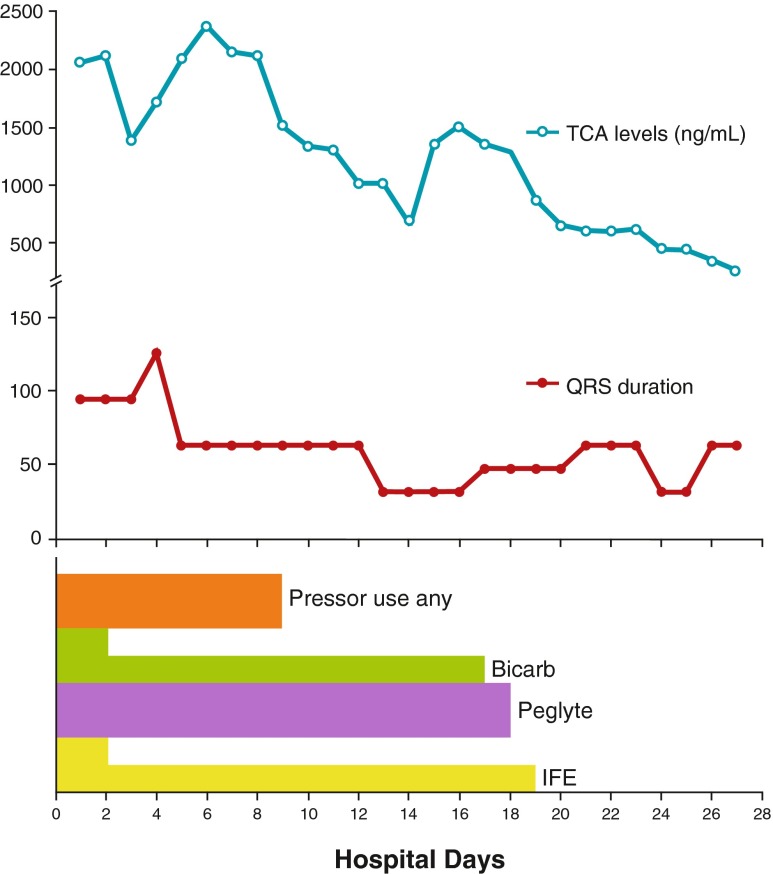
Fig. 2.
Chart summarizing therapies administered, TCA levels, and QRS duration over time after initial resuscitation. The increase in the QRS interval on day 2 followed discontinuation of the ILE infusion and prompted a rebolus of 250 mL 20 % ILE and reinitiation of an infusion at 100 mL/h for further 24 h after which the rate was decreased to 18 mL/h. Following this, the QRS duration remained within the normal range despite rising/very elevated TCA levels (half size bar indicates lower-dose bicarbonate and ILE infusions, respectively)

