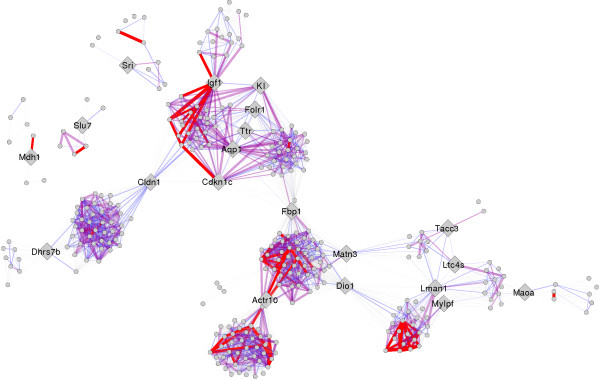
Figure 3.

The GO edge annotated network. The GO edge annotated network where only edges with a score of 0 or higher (maximum score = 11) are opaque, and the edge with represents this score (the thicker the edge the higher the score. Edge color represents score in the following ranges: gray ➔ -12 to 0, blue ➔ 1 to 3, purple ➔ 4 to 7, red ➔ 8 to 11. Gateway nodes are represented as large gray diamonds, and other nodes are reduced in size for easier viewing. Immediately visible are thick red edges connected to gateway nodes Igf1, Cdkn1c, and Actr10.
