
Figure 4.
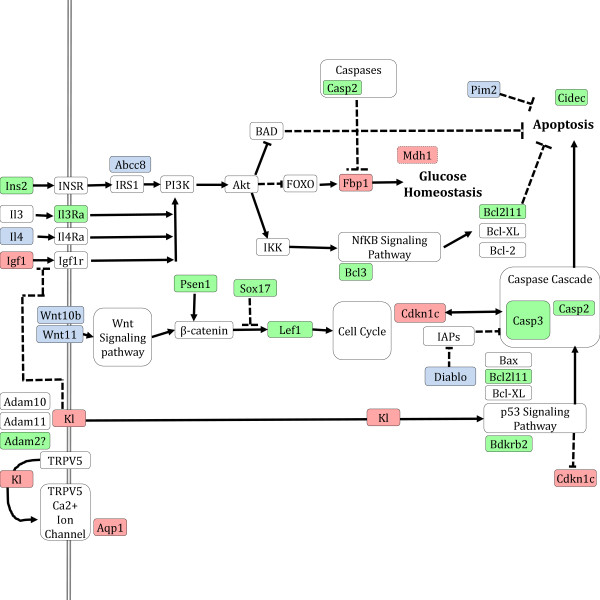
The model that was created using interactions between gateway nodes and cluster. The grey double edged line is the cell membrane, red nodes are gateway nodes, green nodes are young nodes, blue nodes are aged nodes, and white nodes are added in to connect these nodes. Edges with a flat top indicate inhibition and edges with arrows indicate directed interaction.