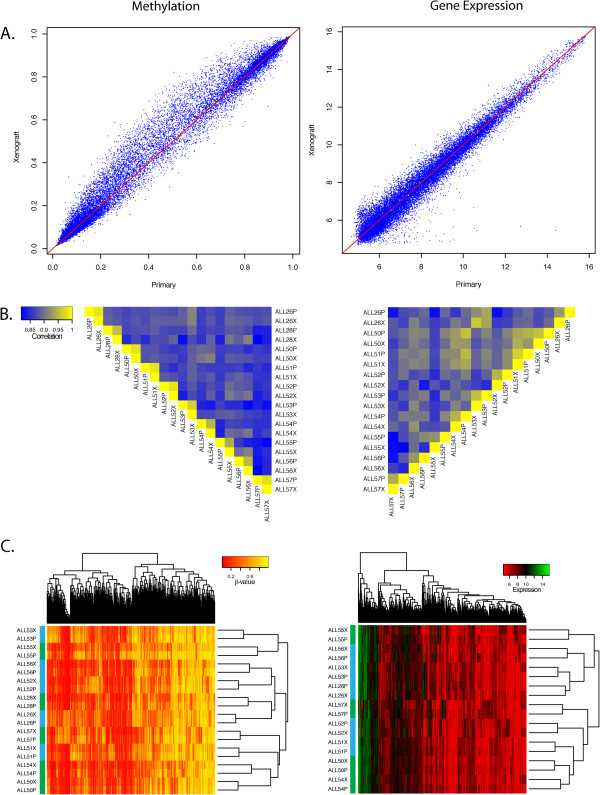
Figure 1.

Comparisons of DNA methylation and gene expression profiles between primary tumour tissue and xenografts. (A) Scatterplots of DNA methylation and gene expression array results from ALL26 showing high correlation between primary and xenograft tumours. (B) Heatmap plot of Pearson’s correlation coefficients of all primary and xenograft samples analysed for DNA methylation and gene expression. Coefficients greater than 0.94 and 0.84 between matching primary and xenograft tumours were observed for DNA methylation and gene expression respectively. (C) Heatmap plot of the most variable DNA methylation and gene expression probes. A high level of similarity between matching primary and xenograft tumours resulted in all pairs clustering together. Green Sample Bar depicts PPR, Blue sample Bar depicts PGR.
