Figure 3.

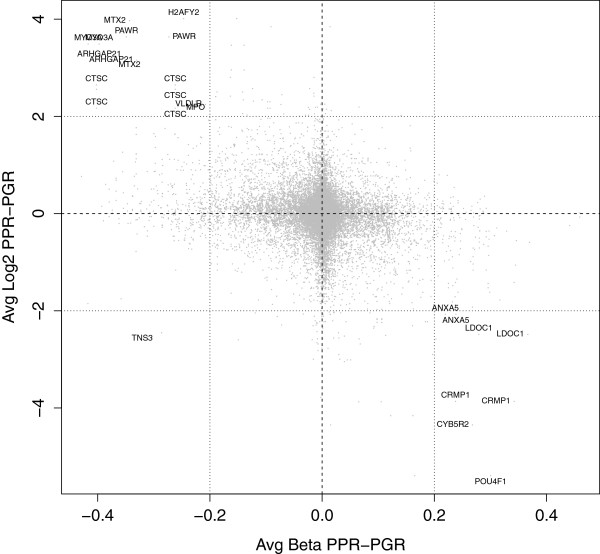
Scatterplot of the average DNA methylation and gene expression difference between PPR and PGR samples reveals 20 genes with a negative association between gene expression and DNA methylation.

Scatterplot of the average DNA methylation and gene expression difference between PPR and PGR samples reveals 20 genes with a negative association between gene expression and DNA methylation.