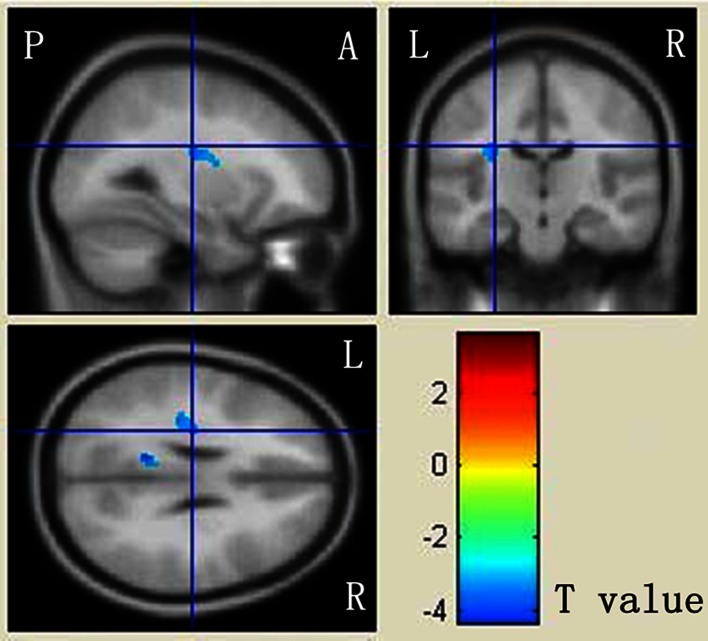
Fig. 3.
Mapping of MD differences between ASD patients and DD controls. The localization of regions showing significant difference (p < 0.001) were projected into a template created with the data from our participants output from the SPM8. The anatomical locations of regions were listed in Table 3D. The regions that are decreased for ASD than DD are presented in yellow to blue. L left, R right, A anterior, P posterior

