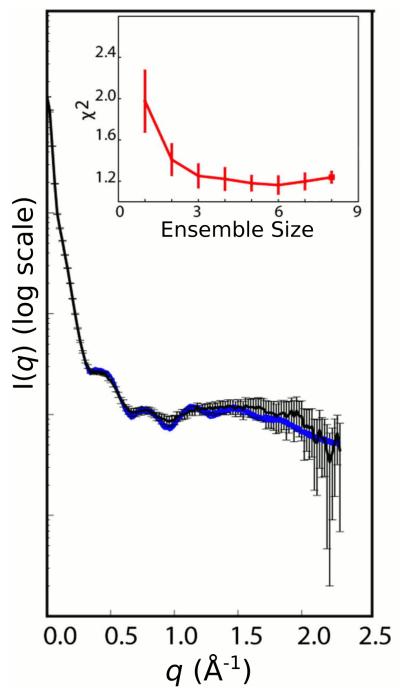
Figure 12.
Experimental SAXS/WAXS curve for the RRE RNA [42] with experimental error overlaid in black with 20 calculated SAXS/WAXS curves (blue) calculated from ensemble calculations employing three ensemble members. The inset shows the χ2 fit to experiment versus ensemble size. Adapted from Fang et. al. [42] published in Cell (Elsevier) while the authors were U.S. Government employees at the National Institutes of Health.

