
Figure 2.
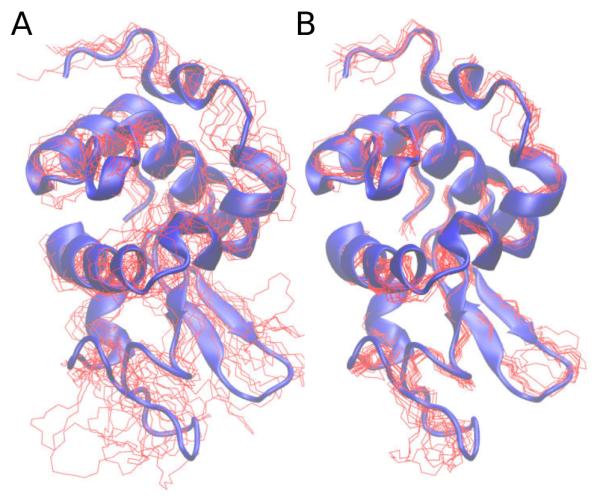
The structure of hen egg white lysozyme. Red lines depict backbone coordinates of the lowest energy 10 structures calculated omitting SAXS/WAXS data (Panel A) and including SAXS/WAXS data (panel B). Both calculations included NMR data [23]. The two panels contain a blue cartoon representation of the X-ray structure from PDB ID 193L [24].